


Klipfolio Overview
Klipfolio transforms data into actionable insights, enabling businesses to make informed decisions swiftly. This dashboard and reporting analytics platform supports organizations in visualizing key metrics, enhancing data-driven strategies. Klipfolio's customizable dashboards cater to diverse business needs, offering seamless integration with over 100 technology partners. This flexibility ensures that companies can tailor their analytics to align with specific objectives, driving improved outcomes. By centralizing data, Klipfolio empowers teams to track performance in real-time, fostering a culture of transparency and accountability. The platform's robust capabilities facilitate strategic market positioning, ultimately contributing to a higher return on investment.
Use Cases
Customers recommend Social Media Management, Helpdesk Management, Advertisement, as the business use cases that they have been most satisfied with while using Klipfolio.
Business Priorities
Acquire Customers and Enhance Customer Relationships are the most popular business priorities that customers and associates have achieved using Klipfolio.
Klipfolio Use-Cases and Business Priorities: Customer Satisfaction Data
Klipfolio works with different mediums / channels such as Social Media. Chat. Facebook etc.
Klipfolio's features include Dashboard, Templates, Personalization, etc. and Klipfolio support capabilities include 24/7 Support, Chat Support, Email Support, etc. also Klipfolio analytics capabilities include Analytics, and Custom Reports.
Reviews
"Our leadership team is making smarter decisions and were on target to grow by 40 - 50% this year thanks to our insights from Klipfolio." - Brian Dainis
Peer review evidence (same sources as the product rating summary)
"...Tools that can help in this space with dashboards and reports include Agency Analytics, Klipfolio and Cyfe. ..." 5 tips to automate tasks in your creative business
"...Combined with an amazing, always-helpful, professional support team, Klipfolio is a tool you can't go wrong with...." Peer review by Christian P, Director of Advertising, Marketing and Advertising
"...By removing the knowledge barriers between different source systems such as Google Analytics, Survey Monkey, Google Ads or SQL databases, any user can view performance in a common visual interface provided by Klipfolio...." Peer review by Francois Salvert, Web Analytics and Data dashboarding (consulting mandate), Keolis Canada
Klipfolio, TWIPLA, Bloomreach, Buildfire, Unity Platform, etc., all belong to a category of solutions that help Business Intelligence. Each of them excels in different abilities. Therefore, determining the best platform for your business will depend on your specific needs and requirements.
Klipfolio helps data teams deliver curated, trusted data and self-serve analytics to business users. Decision makers benefit from straightforward access to essential data.
Popular Business Setting
for Klipfolio
Top Industries
- Marketing and Advertising
- Computer Software
- Information Technology and Services
Popular in
- Small Business
- Mid Market
- Enterprise
Klipfolio is popular in Marketing And Advertising, Computer Software, and Information Technology And Services and is widely used by Small Business, Mid Market, and Enterprise.
Klipfolio Customer wins, Customer success stories, Case studies
How does Klipfolio address your Helpdesk Management Challenges?
How does Klipfolio address your Advertisement Challenges?
How efficiently Does Klipfolio manage your Communication Management?
How can Klipfolio enhance your Engagement Management process?
| CUSTOMERS | TESTIMONIALS |
|---|---|

|
Our leadership team is making smarter decisions and were on target to grow by 40 - 50% this year thanks to our insights from Klipfolio. Testimonial By Brian Dainis |

|
Life before Klipfolio was painful. We had previously struggled with all our disparate systems that contained important data. Being able to see all our data in one spot has significantly increased our ability to make informed decisions quickly. Testimonial By Roger Crist |

|
We’ve grown by over 300% since using Klipfolio, and the decisions that led to this growth have come from data displayed on Klipfolio. Testimonial By Marcus Taylor |
| CUSTOMERS | TESTIMONIALS |
|---|---|
|
Brian Dainis Founder and CEO Curotec |
Our leadership team is making smarter decisions and were on target to grow by 40 - 50% this year thanks to our insights from Klipfolio. Testimonial By Brian Dainis |
|
Roger Crist Director of Business Intelligence eFileCabinet |
Life before Klipfolio was painful. We had previously struggled with all our disparate systems that contained important data. Being able to see all our data in one spot has significantly increased our ability to make informed decisions quickly. Testimonial By Roger Crist |
|
Marcus Taylor Founder and CEO Venture Harbour |
We’ve grown by over 300% since using Klipfolio, and the decisions that led to this growth have come from data displayed on Klipfolio. Testimonial By Marcus Taylor |
Wicket - Computer Software - Small
Netguru - Information Technology And Services - Medium
Lexington Podiatry - Hospital & Health Care - Small
Laundry Jeans - Apparel & Fashion - Medium
Ekstra Bladet - Media Production - Medium
Frequently Asked Questions (FAQ)
What buyers ask before choosing Klipfolio
Integrations What CRM integrations are available with Klipfolio?
Klipfolio offers a variety of CRM integrations to help businesses streamline their data visualization and reporting processes. Notable CRM platforms that integrate seamlessly with Klipfolio include HubSpot, Salesforce, and Pipedrive. These integrations allow users to connect their CRM data directly to Klipfolio dashboards, enabling real-time tracking of key metrics such as sales performance, customer engagement, and pipeline management. Additionally, Klipfolio supports over 250 prebuilt data connectors, making it easy to pull in data from various sources and create customized dashboards that reflect your business's unique needs. This capability enhances data accessibility and transparency across teams, ultimately driving informed decision-making and improved operational efficiency.
Integrations How does Klipfolio connect to Salesforce and what setup steps are required?
Klipfolio connects to Salesforce through its extensive library of over 250 prebuilt data connectors, allowing users to easily integrate their Salesforce data into customizable dashboards. To set up this connection, first, log into your Klipfolio account and navigate to the "Data Sources" section. From there, select the Salesforce connector and authenticate your Salesforce account by entering your credentials. Once connected, you can choose specific reports or fields from your Salesforce instance to display in your Klipfolio dashboards. After selecting the desired data, you can customize the visual presentation and share the dashboards with your team, ensuring that critical metrics are accessible to all stakeholders. This integration enhances data transparency and enables informed decision-making across your organization.
Integrations Can I integrate HubSpot with Klipfolio to create custom dashboards?
Yes, you can integrate HubSpot with Klipfolio to create custom dashboards that provide valuable insights into your business performance. Klipfolio offers over 250 prebuilt data connectors, including one for HubSpot, allowing you to pull key metrics directly from your HubSpot account into your Klipfolio dashboards. This integration enables you to visualize important data such as lead conversion rates, website traffic, and customer engagement in real-time, helping your team make data-driven decisions. By leveraging this integration, you can customize your dashboards to reflect the metrics that matter most to your business, ensuring that you have a comprehensive view of your marketing and sales performance.
Integrations What is the API access like for Klipfolio integrations with data providers?
Klipfolio offers robust API access for integrating with various data providers, allowing users to connect seamlessly to multiple data sources. With over 250 pre-built data connectors, Klipfolio's API facilitates the retrieval of data from cloud services, on-premise servers, and spreadsheets, ensuring that users can pull in the necessary information effortlessly. The API supports JSON and SQL, enabling technical teams to customize their data queries and streamline the integration process. This flexibility allows businesses to create tailored dashboards that meet their specific needs while maintaining data governance through user roles and permissions. Overall, Klipfolio's API access enhances data accessibility and empowers teams to make informed decisions based on real-time insights.
Integrations How does data flow between Klipfolio and other tools like Marketo or Pipedrive?
Data flows between Klipfolio and other tools like Marketo or Pipedrive through Klipfolio's extensive library of over 250 prebuilt data connectors, which facilitate seamless integration. When you connect these tools to Klipfolio, data is automatically retrieved and updated in real-time, allowing you to create dynamic dashboards that reflect the latest metrics. For instance, you can pull marketing performance data from Marketo or sales metrics from Pipedrive, enabling you to visualize key performance indicators such as conversion rates or campaign effectiveness. Additionally, Klipfolio allows for customization of data views, so you can segment information based on user roles or create white-labeled dashboards that align with your brand. This integration not only streamlines reporting processes but also enhances data accessibility across your organization, ensuring that all stakeholders have the insights they need to make informed decisions.
Integrations Are there any limitations to the integrations available with Klipfolio?
Klipfolio offers over 250 prebuilt data connectors, allowing users to integrate with a wide range of popular services such as HubSpot, Salesforce, Google Sheets, and BigQuery. However, while this extensive library covers many common tools, there may be limitations regarding specific integrations, particularly for niche or less widely used platforms. Additionally, the complexity of certain integrations can vary, with some requiring more technical expertise to set up, especially when dealing with custom APIs or data sources. Users should also consider that while Klipfolio provides robust capabilities for data retrieval and dashboard creation, the effectiveness of these integrations can depend on the quality and structure of the data being pulled from the connected services.
Features What does the Klipfolio dashboard feature do?
The Klipfolio dashboard feature allows users to create customizable, real-time visualizations of their data, making it easier to monitor key performance indicators (KPIs) and track business metrics. With its user-friendly interface, Klipfolio enables both technical and non-technical users to build dashboards that can display data from various sources, including MySQL queries, social media, and marketing platforms. This feature not only automates reporting, saving time on manual tasks, but also enhances collaboration through built-in tools for commenting and troubleshooting. By providing clear visual representations of complex data, Klipfolio helps businesses make informed decisions quickly, ensuring that all team members have access to the same up-to-date information.
Features How do I embed a dashboard in my product using Klipfolio?
To embed a dashboard in your product using Klipfolio, start by creating your desired dashboard within the Klipfolio platform. Once your dashboard is ready, navigate to the sharing options and select the "Embed" feature. Klipfolio provides you with an embed code that you can customize according to your needs, such as adjusting the size and appearance. Copy this code and integrate it into your product's HTML where you want the dashboard to appear. Additionally, ensure that you have set the appropriate permissions for users to access the dashboard securely. Klipfolio's seamless integration capabilities allow you to automate updates and provide real-time insights, enhancing the value of your product for users. For further assistance, refer to Klipfolio's extensive onboarding resources or contact their support team.
Features What are Klips and how do I use them to create custom reports?
Klipfolio Klips are customizable data visualizations that allow users to create tailored dashboards and reports by integrating data from over 130 services, including HubSpot, Salesforce, and Google Sheets. To use Klips for creating custom reports, start by connecting your desired data sources within the Klipfolio platform. Next, utilize the intuitive drag-and-drop interface to select and arrange various visualization types, such as charts, graphs, and tables, to represent your data effectively. You can also automate data refreshes to ensure your reports are always up-to-date. Once your dashboard is built, you can share it with your team or clients, customize it with your branding, and segment views based on user roles. This process not only streamlines reporting but also enhances decision-making by providing real-time insights.
Features How can I automate updates for my Klipfolio dashboards?
To automate updates for your Klipfolio dashboards, you can leverage Klipfolio's powerful integration capabilities and data sources. Start by connecting your data sources, such as MySQL, Google Analytics, or other APIs, to Klipfolio. Once connected, you can create custom queries that pull in the data you need. Klipfolio allows you to set up automatic refresh intervals for your dashboards, ensuring that your data is always up-to-date without manual intervention. Additionally, you can utilize Klips to visualize this data in real-time, making it accessible for your team. For further automation, consider using Klipfolio's email and CSV-based automation workflows to deliver reports directly to stakeholders. This streamlined approach saves time and enhances decision-making by providing timely insights.
Features What functionality does Klipfolio provide for real-time data visualization?
Klipfolio provides robust functionality for real-time data visualization through its customizable dashboards and Klips, which allow users to consolidate and streamline complex data from over 130 data services without the need for a data warehouse. Users can create pixel-perfect visualizations that automatically update, showcasing data in real-time to facilitate immediate insights. The platform supports extensive formulas and functions for filtering, grouping, aggregating, and sorting data, enabling dynamic value assignments based on user input. This functionality not only saves time by reducing manual reporting efforts but also enhances collaboration by allowing easy sharing of dashboards across teams. With Klipfolio, businesses can effectively visualize key performance indicators and trends, driving informed decision-making and strategic initiatives.
Features How do I manage client accounts and dashboards within Klipfolio?
To manage client accounts and dashboards within Klipfolio, start by accessing the Klipfolio for Partners platform, which is designed specifically for consultants and advisors. From your parent account, you can create and customize client accounts by selecting the number of dashboards and users, ensuring you meet the minimum requirements of one for each. You can also assign resources to each client account, which are drawn from your parent account's plan. As you set clients to an Active state, you can enable specific features tailored to their needs. Additionally, Klipfolio allows you to automate reporting and centralize data, making it easier to deliver insights and scale your services efficiently. For further guidance, refer to the Jumpstart Guide for Partners or access the Knowledge Base for detailed articles.
ROI & pricing What are the key benefits of using Klipfolio for business intelligence?
Klipfolio offers several key benefits for business intelligence that can significantly enhance organizational performance. Firstly, it provides a user-friendly platform for creating self-service dashboards, allowing teams to visualize data in real-time and make informed decisions quickly. With over 130 pre-built data connectors and REST API capabilities, Klipfolio enables seamless integration with various data sources, ensuring that users have access to the most relevant metrics. This accessibility fosters company-wide transparency, empowering employees to understand the correlation between their efforts and business outcomes, which can lead to smarter strategies and improved productivity. Additionally, Klipfolio's ability to display dashboards on big screens during meetings keeps critical data top of mind, enhancing communication and collaboration among stakeholders. Overall, Klipfolio equips businesses with the tools needed to leverage data effectively, driving growth and success.
ROI & pricing How can Klipfolio improve ROI for my business?
Klipfolio can significantly improve ROI for your business by providing real-time dashboards that consolidate data from various sources, such as HubSpot, Salesforce, and Google Sheets, into one accessible platform. This self-service business intelligence tool allows teams to visualize key performance indicators (KPIs) and metrics that matter most to their operations, enabling informed decision-making. By replacing static spreadsheets with dynamic dashboards, businesses can save time on reporting and analysis, reduce the risk of errors, and enhance clarity in data presentation. Additionally, Klipfolio's ability to white-label dashboards and segment views for different stakeholders ensures that insights are tailored and actionable, ultimately driving better performance and higher returns on investment.
ROI & pricing What pricing plans does Klipfolio offer for its business intelligence software?
Klipfolio offers flexible pricing plans for its business intelligence software, designed to accommodate a range of user needs from startups to Fortune 500 companies. The pricing typically ranges from $100 to $900 per month for agencies, with custom plans and add-ons available for businesses with more complex requirements. This scalability ensures that organizations can find a plan that fits their budget while still accessing the powerful features of Klipfolio Klips. Additionally, Klipfolio provides a free 14-day trial, allowing potential users to explore the platform's capabilities before committing to a subscription. This approach not only makes Klipfolio an affordable option but also allows businesses to tailor their investment based on their specific analytics and dashboard needs.
ROI & pricing What is the total cost of ownership for using Klipfolio?
The total cost of ownership for using Klipfolio includes several factors such as subscription fees, implementation services, and potential add-ons. Klipfolio offers flexible pricing plans that scale according to user needs, with fixed monthly costs for agencies like Livedata.Mobi ranging from $100 to $900, depending on the complexity of the services required. Additionally, businesses may incur costs for onboarding and training, which are tailored to help teams maximize the platform's capabilities. While the initial investment may vary based on the specific requirements of your organization, Klipfolio's cost-effectiveness and the potential for improved data-driven decision-making can lead to significant long-term savings and enhanced operational efficiency. For a precise estimate, it's advisable to contact Klipfolio's Success Team to discuss your unique needs and explore custom plans.
ROI & pricing How quickly can I expect to see value from implementing Klipfolio?
When implementing Klipfolio, you can expect to see value relatively quickly, often within a few days to weeks, depending on your specific setup and data sources. Klipfolio's user-friendly interface allows for rapid onboarding and dashboard creation, enabling teams to transform fragmented data into actionable insights almost immediately. Many users report that they can start building dashboards and visualizations within hours, leveraging pre-built templates and integrations with popular tools like HubSpot, Salesforce, and Google Sheets. This swift implementation not only enhances internal workflows but also improves client satisfaction by providing real-time access to key metrics. By proactively showcasing data, businesses can empower their teams and clients, driving better decision-making and ultimately increasing client lifetime value.
ROI & pricing What cost savings can businesses achieve by using Klipfolio for data visualization?
Businesses can achieve significant cost savings by using Klipfolio for data visualization through enhanced efficiency and reduced manual reporting efforts. By automating the creation of real-time dashboards, companies like Premier Stationery have reported saving up to an hour of work per day, which translates to substantial labor cost reductions over time. Klipfolio's ability to integrate with various tools such as HubSpot, Salesforce, and Google Sheets allows teams to consolidate fragmented data, minimizing the time spent on data gathering and analysis. This streamlined access to insights not only empowers employees to make informed decisions faster but also enhances overall productivity, leading to better resource allocation and improved business outcomes. Ultimately, Klipfolio helps organizations optimize their operations, resulting in both time and cost savings.
Capabilities Can Klipfolio automate the creation of dashboards for my team?
Yes, Klipfolio can automate the creation of dashboards for your team, significantly enhancing efficiency and data visualization. With Klipfolio, you can utilize custom queries to pull data from various sources, including MySQL, and automatically update your dashboards in real-time. This automation eliminates the need for manual reporting, allowing your team to focus on analysis rather than data collection. Additionally, Klipfolio offers features like pre-built Klips and a flexible dashboard design that caters to non-technical users, making it easy for anyone on your team to create and customize dashboards. By automating dashboard creation, Klipfolio ensures that everyone has access to the same up-to-date information, fostering better collaboration and informed decision-making across your organization.
Capabilities Does Klipfolio support real-time data visualization for financial metrics?
Yes, Klipfolio supports real-time data visualization for financial metrics, making it an ideal tool for businesses looking to monitor their financial performance continuously. With Klipfolio, users can create interactive dashboards that showcase key financial indicators such as cash flow, revenue, and expenses, all updated automatically. This capability allows teams to visualize complex financial data in real-time, facilitating quicker decision-making and enhancing overall transparency. Additionally, Klipfolio's integration with various data sources, including secure SQL and APIs, ensures that financial metrics are always current, enabling users to share insights easily with stakeholders. By leveraging Klipfolio's powerful visualization tools, organizations can maintain a strong grasp on their financial health and performance metrics, ultimately driving better business outcomes.
Capabilities Can Klipfolio integrate data from multiple sources into a single dashboard?
Yes, Klipfolio can integrate data from multiple sources into a single dashboard, making it an ideal solution for businesses that require comprehensive reporting. With over 250 prebuilt data connectors, Klipfolio allows users to easily connect various platforms, including MySQL, HubSpot, Amazon Redshift, Google BigQuery, and many others. This capability enables organizations to consolidate fragmented data into cohesive visualizations, facilitating real-time monitoring and analysis. By leveraging Klipfolio's extensive library of formulas and functions, users can filter, group, and aggregate data dynamically, ensuring that all relevant information is accessible in one place. This integration not only streamlines reporting processes but also enhances decision-making by providing a single source of truth for teams and clients alike.
Capabilities Does Klipfolio provide features for managing multi-tenant deployments?
Yes, Klipfolio provides robust features specifically designed for managing multi-tenant deployments, making it an ideal choice for software companies and OEMs. With Klipfolio for Partners, users can securely embed dashboards and maintain control over branding and data delivery across multiple clients from a single platform. This capability allows organizations to efficiently manage various client accounts while ensuring that each client has a tailored experience. The API-first foundation of Klipfolio further enhances flexibility, enabling seamless integration with other tools and services. By leveraging these features, businesses can scale their operations, improve client reporting, and deliver customized insights, ultimately driving better data-driven decision-making for their clients.
Capabilities Can Klipfolio help track key performance indicators across different teams?
Yes, Klipfolio can effectively track key performance indicators (KPIs) across different teams by integrating data from various sources such as HubSpot, Salesforce, Pipedrive, and Google Sheets. This flexibility allows organizations to create customized dashboards that reflect the specific metrics that matter most to each team, whether it's growth rate, churn, or operational KPIs. Klipfolio's ability to connect fragmented data into a single source of truth enables real-time visibility and democratizes access to data, ensuring that all teams can monitor their performance consistently. Additionally, users can segment views for internal and client-facing purposes, making it easier to tailor insights for different stakeholders. This comprehensive approach not only enhances transparency but also supports informed decision-making across the organization.
Capabilities Does Klipfolio offer tools for embedding dashboards within my product?
Yes, Klipfolio offers robust tools for embedding dashboards within your product, making it an ideal solution for software companies and OEMs. With Klipfolio, you can seamlessly integrate powerful analytics and real-time dashboards directly into your application or portal, allowing your users to access insights without the need to build reports from scratch. The platform supports multi-tenant deployments and provides an API-first foundation, ensuring secure and customizable branding and data delivery. This capability not only enhances user experience but also empowers your clients to act on data-driven insights effectively. By leveraging Klipfolio's embedding features, you can automate updates and scale reporting effortlessly, ultimately adding significant value to your product offering.
Use cases How can SDRs use Klipfolio to improve their reporting and tracking of sales metrics?
Sales Development Representatives (SDRs) can leverage Klipfolio to enhance their reporting and tracking of sales metrics by creating customized dashboards that consolidate key performance indicators (KPIs) in real-time. By integrating data from platforms like Salesforce and HubSpot, SDRs can visualize metrics such as lead conversion rates, call volumes, and pipeline status, allowing for immediate insights into their performance. Klipfolio's user-friendly interface enables SDRs to build and modify dashboards without extensive technical knowledge, fostering a culture of data transparency within the team. Additionally, SDRs can utilize Klipfolio's templates for standard reporting, ensuring consistency and efficiency in tracking their progress and identifying areas for improvement, ultimately driving better sales outcomes.
Use cases What are the best use cases for marketers to automate client reporting with Klipfolio?
Klipfolio is an excellent tool for marketers looking to automate client reporting, particularly in scenarios where data from multiple sources needs to be consolidated into clear, actionable insights. One of the best use cases is for marketing agencies managing diverse campaigns across platforms like Google Ads, social media, and email marketing, as Klipfolio can integrate these data streams into real-time dashboards. This automation significantly reduces the time spent on manual reporting—The Bakery, for instance, cut their report generation time from a week to under two days. Additionally, Klipfolio's user-friendly visualizations make it easy for non-technical users to understand complex data, enhancing client communication and decision-making. Overall, automating client reporting with Klipfolio allows marketers to focus on strategy and insights rather than tedious data collection.
Use cases In what scenarios can RevOps teams benefit from using Klipfolio for real-time data visualization?
RevOps teams can significantly benefit from using Klipfolio for real-time data visualization in several scenarios. For instance, when tracking key performance indicators (KPIs) across sales, marketing, and customer success, Klipfolio enables teams to visualize data from various sources like Salesforce and Google Analytics in real time. This immediate access allows RevOps teams to quickly identify trends, such as a drop in conversion rates or customer engagement, and respond proactively rather than waiting for end-of-week reports. Additionally, Klipfolio's dashboards facilitate cross-departmental collaboration by providing a shared view of performance metrics, which enhances transparency and aligns efforts towards common goals. By leveraging Klipfolio, RevOps teams can improve decision-making speed, operational efficiency, and ultimately drive better business outcomes.
Use cases How can sales leaders implement Klipfolio to enhance team alignment and decision-making?
Sales leaders can implement Klipfolio to enhance team alignment and decision-making by creating customized dashboards that visualize key performance indicators (KPIs) and sales metrics in real-time. To start, leaders should identify the most relevant metrics, such as new monthly recurring revenue (MRR), demo calls, and conversion rates, and then utilize Klipfolio's templates to build intuitive dashboards. By integrating data from tools like Salesforce, HubSpot, and Google Sheets, sales teams can gain a comprehensive view of their performance. Regularly updating these dashboards ensures that all team members have access to the same information, fostering transparency and collaboration. Additionally, using features like real-time leaderboards can motivate the team and create a competitive environment, ultimately driving better decision-making and alignment towards common goals.
Use cases What workflows can marketing agencies streamline by using Klipfolio for campaign performance tracking?
Marketing agencies can significantly streamline their workflows by using Klipfolio for campaign performance tracking through automated reporting and real-time dashboards. By consolidating data from various sources such as PPC, SEO, and social media into a single platform, agencies can eliminate the time-consuming process of manual reporting and data compilation. Klipfolio allows agencies to create white-label dashboards that provide clients with instant access to performance metrics, enhancing transparency and client satisfaction. Additionally, the ability to use templates for different types of campaigns enables agencies to onboard new clients quickly and efficiently, reducing the time spent on setup. This automation not only saves hours each week but also allows teams to focus on strategic insights rather than repetitive tasks, ultimately boosting productivity and campaign effectiveness.
Use cases How does Klipfolio help small teams in the IT sector transition from manual reporting to automated dashboards?
Klipfolio helps small teams in the IT sector transition from manual reporting to automated dashboards by providing a user-friendly platform that simplifies data visualization and reporting processes. For instance, Clarity Wave, a small SaaS company, successfully moved from manual Excel reporting to real-time dashboards using Klipfolio Klips. This transition allowed them to automate the tracking of key metrics such as revenue and user numbers, significantly reducing the time spent on report generation from several days to mere moments. Klipfolio's integration capabilities with tools like Google Sheets enable teams to pull data seamlessly, while its clear visualizations make it accessible for non-technical users. Ultimately, Klipfolio empowers small IT teams to make faster, data-driven decisions, enhancing overall efficiency and alignment within the organization.
Alternatives What are the best alternatives to Klipfolio for business intelligence?
When considering alternatives to Klipfolio for business intelligence, several notable options stand out. Tableau is a leading choice, known for its powerful data visualization capabilities and user-friendly interface, making it suitable for both small businesses and large enterprises. Power BI by Microsoft is another strong contender, offering seamless integration with other Microsoft products and robust analytics features at a competitive price. Looker, now part of Google Cloud, excels in data exploration and real-time analytics, while Domo provides a comprehensive platform for data visualization and business intelligence with a focus on collaboration. Additionally, Sisense is recognized for its ability to handle large datasets and provide in-depth analytics. Each of these alternatives has unique strengths, so the best choice will depend on your specific business needs and existing technology stack.
Alternatives How does Klipfolio compare to Tableau in terms of data visualization capabilities?
Klipfolio and Tableau both offer robust data visualization capabilities, but they cater to different user needs and preferences. Klipfolio excels in creating real-time dashboards that automatically update, making it ideal for teams that require immediate access to data and streamlined reporting. Its user-friendly interface allows for custom queries and easy sharing, which enhances collaboration across teams. On the other hand, Tableau is known for its advanced analytics and extensive visualization options, making it suitable for in-depth data analysis and complex visual storytelling. While Tableau may require a steeper learning curve and is often used for larger datasets, Klipfolio's focus on simplicity and real-time updates makes it a strong choice for businesses looking to visualize MySQL data quickly and effectively. Ultimately, the choice between Klipfolio and Tableau depends on your specific data visualization needs and the complexity of the insights you wish to derive.
Alternatives What are the key differentiators between Klipfolio and Google Data Studio?
Klipfolio and Google Data Studio are both powerful tools for data visualization, but they cater to different needs and audiences. Klipfolio is a complete dashboard solution that automates data retrieval and offers extensive customization options, making it ideal for businesses that require real-time monitoring and a high degree of flexibility in dashboard presentation. It integrates seamlessly with various data sources, including Salesforce, HubSpot, and Google Sheets, allowing users to create tailored metrics and reports. In contrast, Google Data Studio is a free tool that excels in creating interactive reports and visualizations, particularly for users already embedded in the Google ecosystem. While it offers ease of use and collaboration features, it may lack the advanced customization and automation capabilities that Klipfolio provides. Ultimately, the choice between the two depends on your specific data needs and the level of complexity you require in your reporting.
Alternatives Why should I consider switching from Klipfolio to Power BI?
When considering a switch from Klipfolio to Power BI, it's essential to evaluate the unique strengths of each platform. Klipfolio excels in providing a user-friendly dashboard solution that automates data retrieval and offers extensive customization options, making it ideal for teams that prioritize real-time data visualization and ease of use. In contrast, Power BI is a more robust analytics platform that integrates seamlessly with Microsoft products and offers advanced data modeling capabilities, making it suitable for organizations that require deeper analytical insights and complex reporting. Additionally, Power BI's AI-driven features can enhance data analysis, while Klipfolio's focus on dashboard presentation may appeal to those needing straightforward visualizations. Ultimately, the choice depends on your organization's specific data needs, existing tools, and the level of analytical depth required.
Alternatives What are the top competitors to Klipfolio for dashboard software?
Klipfolio faces competition from several notable dashboard software providers that cater to various business needs. Some of the top competitors include Tableau, known for its robust data visualization capabilities and extensive analytics features, and Power BI, which integrates seamlessly with Microsoft products and offers powerful reporting tools. Another competitor is Looker, which provides advanced data exploration and business intelligence functionalities. Additionally, Google Data Studio is a popular choice for those seeking a free, user-friendly option for creating interactive dashboards. Each of these alternatives offers unique features and pricing structures, allowing businesses to choose a solution that best fits their specific requirements and budget.
Alternatives Klipfolio vs Looker: which tool offers better analytics features?
When comparing Klipfolio and Looker for analytics features, both tools offer unique strengths tailored to different user needs. Klipfolio excels in providing customizable dashboards and real-time reporting, making it particularly suitable for data analysts who require flexibility and integration with various data sources like HubSpot, Salesforce, and Google Sheets. Its user-friendly interface allows for easy dashboard creation and collaboration. On the other hand, Looker is designed for more complex data modeling and exploration, leveraging a centralized data model that supports advanced analytics and business intelligence capabilities. While Looker may be better for organizations needing deep data insights and extensive data governance, Klipfolio is ideal for teams seeking quick, actionable visualizations and straightforward reporting. Ultimately, the choice depends on your specific analytics requirements and the complexity of your data environment.
Klipfolio Competitors


Klipfolio Features
- Low
- Medium
- High
| FEATURE | RATINGS AND REVIEWS |
|---|---|
| AI Powered | Read Reviews (2) |
| Analytics | Read Reviews (278) |
| Custom Reports | Read Reviews (1447) |
| CAPABILITIES | RATINGS AND REVIEWS |
|---|---|
| AI Powered | Read Reviews (2) |
| Analytics | Read Reviews (278) |
| Custom Reports | Read Reviews (1447) |
Klipfolio Integrations
Klipfolio integrates with a wide range of software applications through its robust data import and export capabilities.





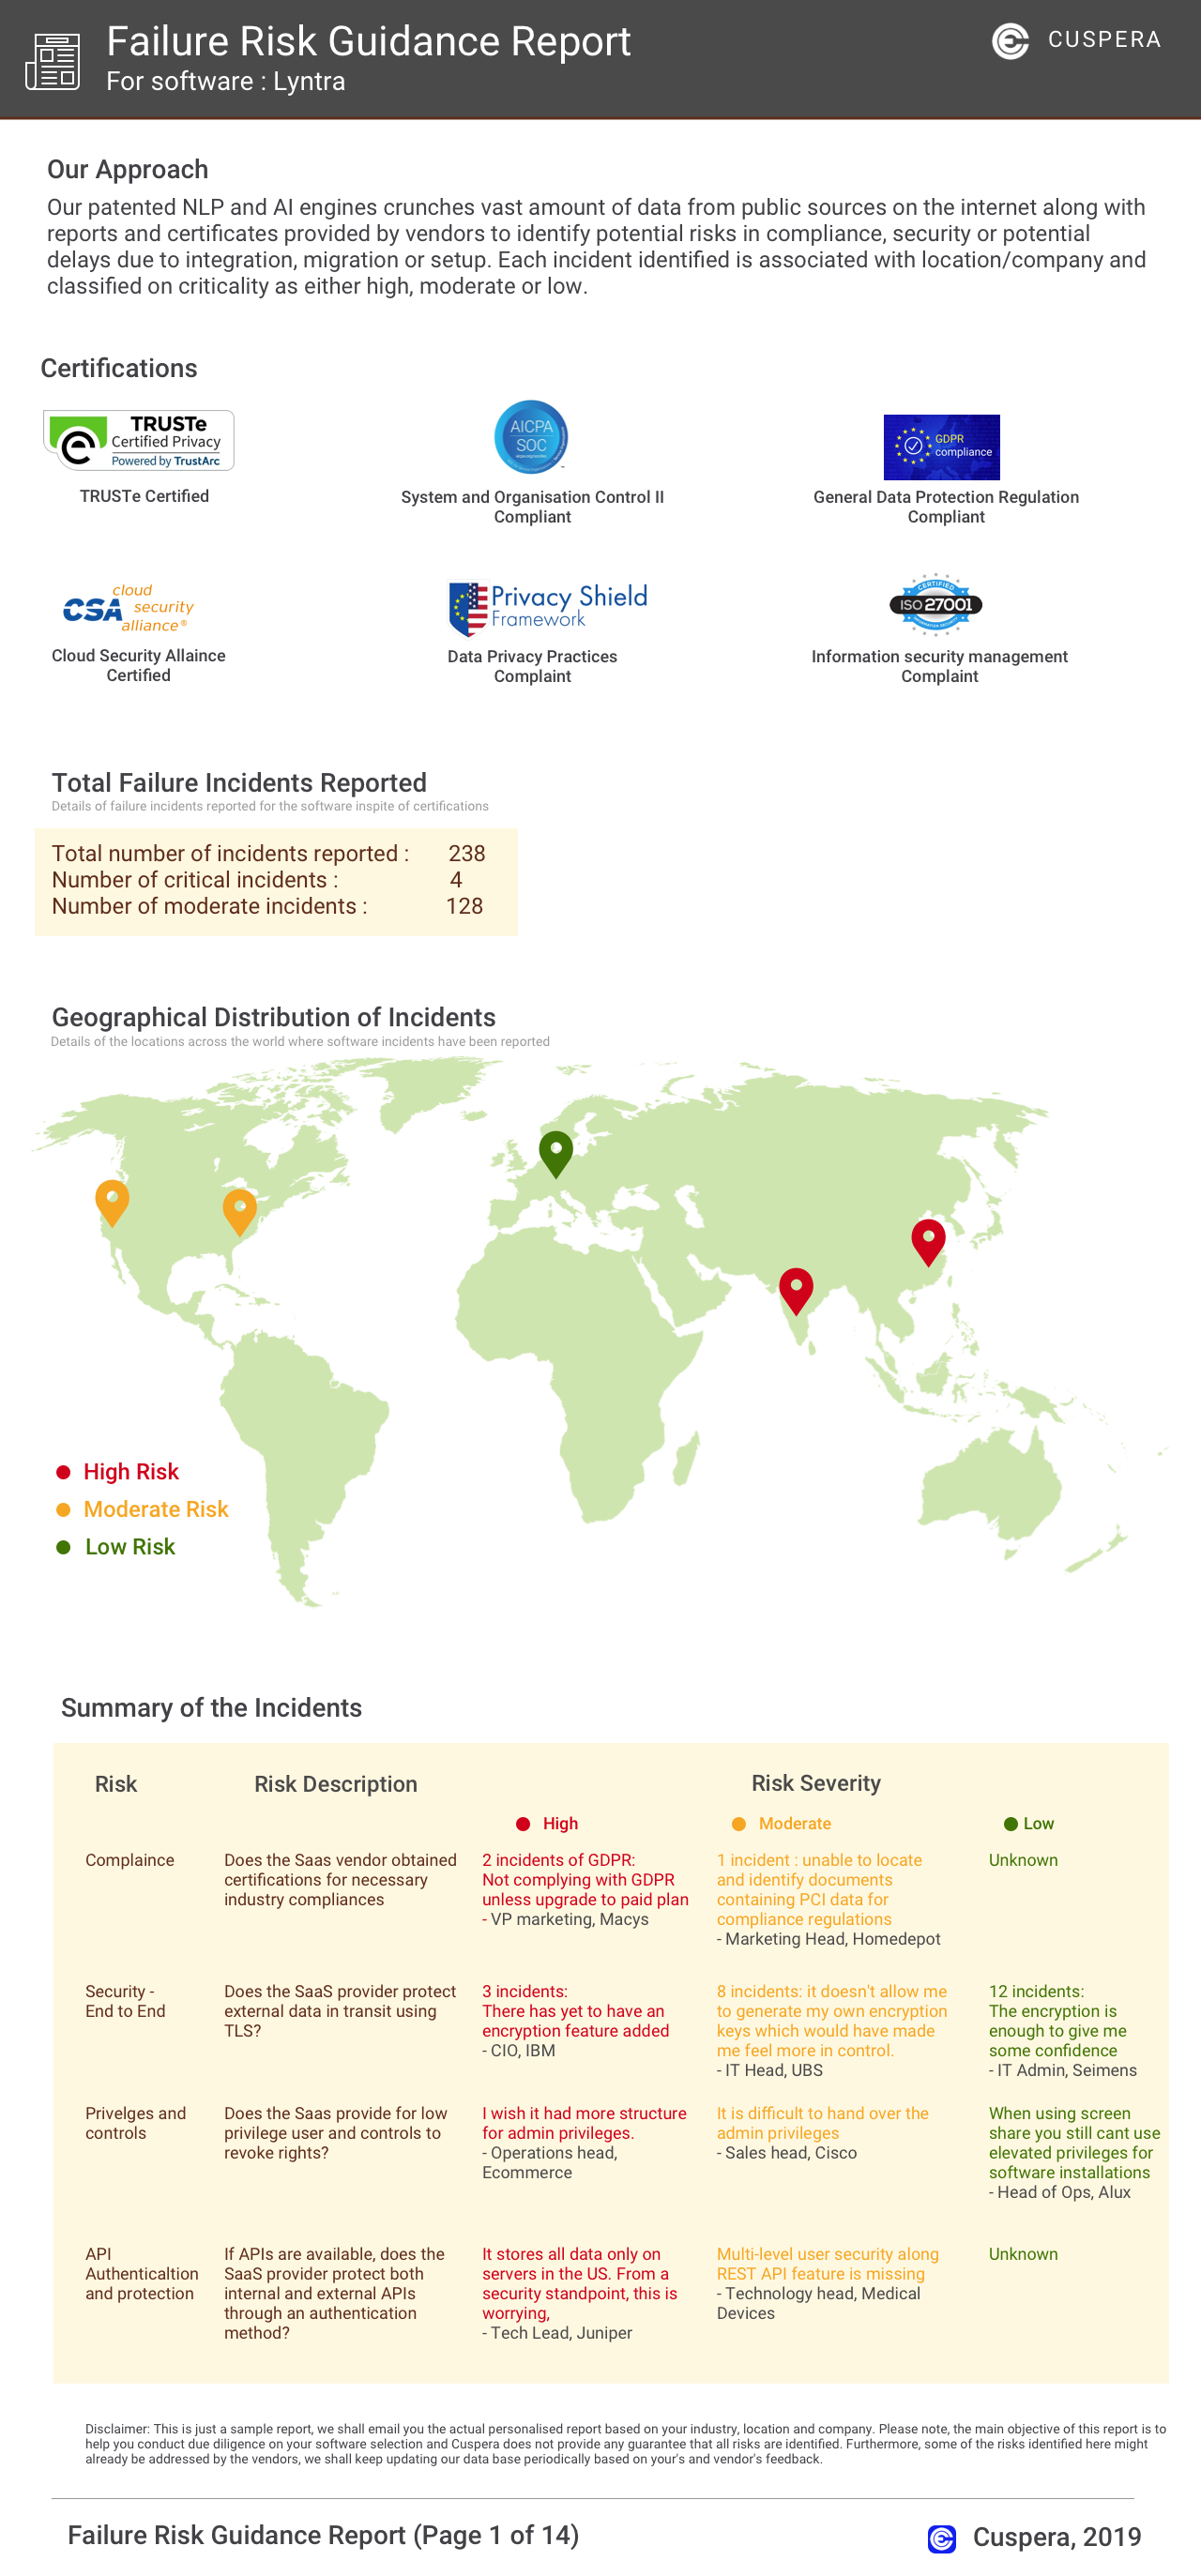
Software Failure Risk Guidance
?for Klipfolio
Overall Risk Meter
Top Failure Risks for Klipfolio
Klipfolio Inc News
Analytics Pioneer Klipfolio Strengthens Board of Directors with Appointment of Ed Bryant and Jonathan Taylor as Independent Directors
Klipfolio has appointed Ed Bryant and Jonathan Taylor as independent directors to its Board of Directors. Their expertise in technology, finance, marketing, and AI operations will support Klipfolio's growth and innovation efforts.
Klipfolio Inc Profile
HQ Location
Suite 300-111 , Albert Street, Ottawa, Ontario K1P1A5
Employees
51-100
Social


Financials
SERIES B

How can Klipfolio enhance your Social Media Management process?