Q analysis software Overview

Q-analysis-software, Q Research Software aids market researchers in quickly uncovering insights. It is designed specifically for market research analysis and reporting.

Use Cases

Customers recommend Market Research, Onboarding, Social Media Analytics, as the business use cases that they have been most satisfied with while using Q analysis software.

Other use cases:

  • Engaging And Following Up
  • Funnel Analysis
  • Workflow Management
  • Helpdesk Management
  • Measuring Customer Satisfaction
  • Lifetime Value Management
  • Content Sharing
See all use cases See less use cases

Business Priorities

Enhance Customer Relationships and Scale Best Practices are the most popular business priorities that customers and associates have achieved using Q analysis software.

Other priorities:

  • Acquire Customers
See all business priorities See less business priorities

Q analysis software Use-Cases and Business Priorities: Customer Satisfaction Data

Q analysis software's features include Feedback Surveys, and Dashboard. and Q analysis software support capabilities include 24/7 Support, AI Powered, Chat Support, etc. also Q analysis software analytics capabilities include Analytics, and Custom Reports.

Reviews

"...Q is by far my favourite software for quantitative market research analysis...." Peer review by User

Q analysis software, Unleashed, Avercast, Prophecy™, Minitab Salford Predictive Modeler, etc., all belong to a category of solutions that help Sales Forecasting. Each of them excels in different abilities. Therefore, determining the best platform for your business will depend on your specific needs and requirements.

Popular Business Setting

for Q analysis software

Top Industries

  • Research
  • Marketing and Advertising
  • Information Technology and Services

Popular in

  • Small Business
  • Mid Market
  • Large Enterprise

Q analysis software is popular in Research, Marketing And Advertising, and Information Technology And Services and is widely used by Small Business, Mid Market, and Large Enterprise.

Comprehensive Insights on Q analysis software Use Cases

How can Q analysis software enhance your Market Research process?

How does Q analysis software address your Onboarding Challenges?

7+ more Business Use Cases

11 buyers and buying teams have used Cuspera to assess how well Q analysis software solved their Sales Forecasting needs. Cuspera uses 402 insights from these buyers along with peer reviews, customer case studies, testimonials, expert blogs and vendor provided installation data to help you assess the fit for your specific Sales Forecasting needs.

Case Studies

CASE STUDY Lewers

Displayr helped Lewers save 71% of the time spent on data analysis and reporting. Lewers used to spend a week updating reports, but now it takes just two days. The team replaced a 140-slide PowerPoin...t with a single dashboard of 30 online pages. Displayr's live dashboards and automation reduced manual work and human error. Clients now access and explore their data more easily, leading to better insights and more value.

CASE STUDY Cygnal

Displayr helped Cygnal cut report creation time by at least 50%. Cygnal needed to make data presentations faster and more interactive for clients. PowerPoint and macros were slow and hard to update. ...Displayr gave them easy drag-and-drop tools, live dashboards, and automatic data updates. Cygnal now delivers better-looking reports and interactive dashboards. This helped them close more deals and save time.

CASE STUDY Davies Hickman

Displayr helped Davies Hickman save over 60% of the time spent on data updates. The team used Displayr to create dashboards and visualizations for clients. This made reporting faster and easier. Clie...nts gained more control over their data. Davies Hickman could focus more on advanced analysis and insights. The support team at Displayr was responsive and helpful.

Marketing and Advertising

CASE STUDY Fifth Dimension Research and Consulting

Displayr helped Fifth Dimension Research and Consulting save time on tracking studies. The team used to spend hours updating thousands of Excel tables. With Displayr, they now use interactive dashboa...rds and automated reporting. This change saves them 5 hours per week on each project. The team can now focus more on insights for their clients.

Marketing and Advertising

CASE STUDY Choice Based Market Insights

Displayr helped Choice Based Market Insights cut analysis and reporting time by over 50%. The team used to juggle three tools for data analysis, charting, and presentations. With Displayr, they now d...o everything in one platform. The software's point-and-click features and dashboarding tools made it easy to re-run analyses in seconds. This let them deliver more value to clients and take on more projects. The founder now has more time for both work and family.

CASE STUDY Power Retail

Displayr helped Power Retail cut data analysis and reporting time by 90%. Mark Fletcher, insights manager, used to outsource analysis, which was slow and costly. With Displayr, his team can now run t...heir own analyses and explore data deeply. This saves thousands of dollars per project. The team now delivers better insights to clients and can handle more complex data easily.

lightning

Peers used Q analysis software for market research and onboarding

Q analysis software Features

  • Low
  • Medium
  • High
FEATURE RATINGS AND REVIEWS
AI Powered

4.07/5

Read Reviews (4)
Analytics

4.80/5

Read Reviews (88)
Custom Reports

4.42/5

Read Reviews (111)
CAPABILITIES RATINGS AND REVIEWS
AI Powered

4.07/5

Read Reviews (4)
Analytics

4.80/5

Read Reviews (88)
Custom Reports

4.42/5

Read Reviews (111)

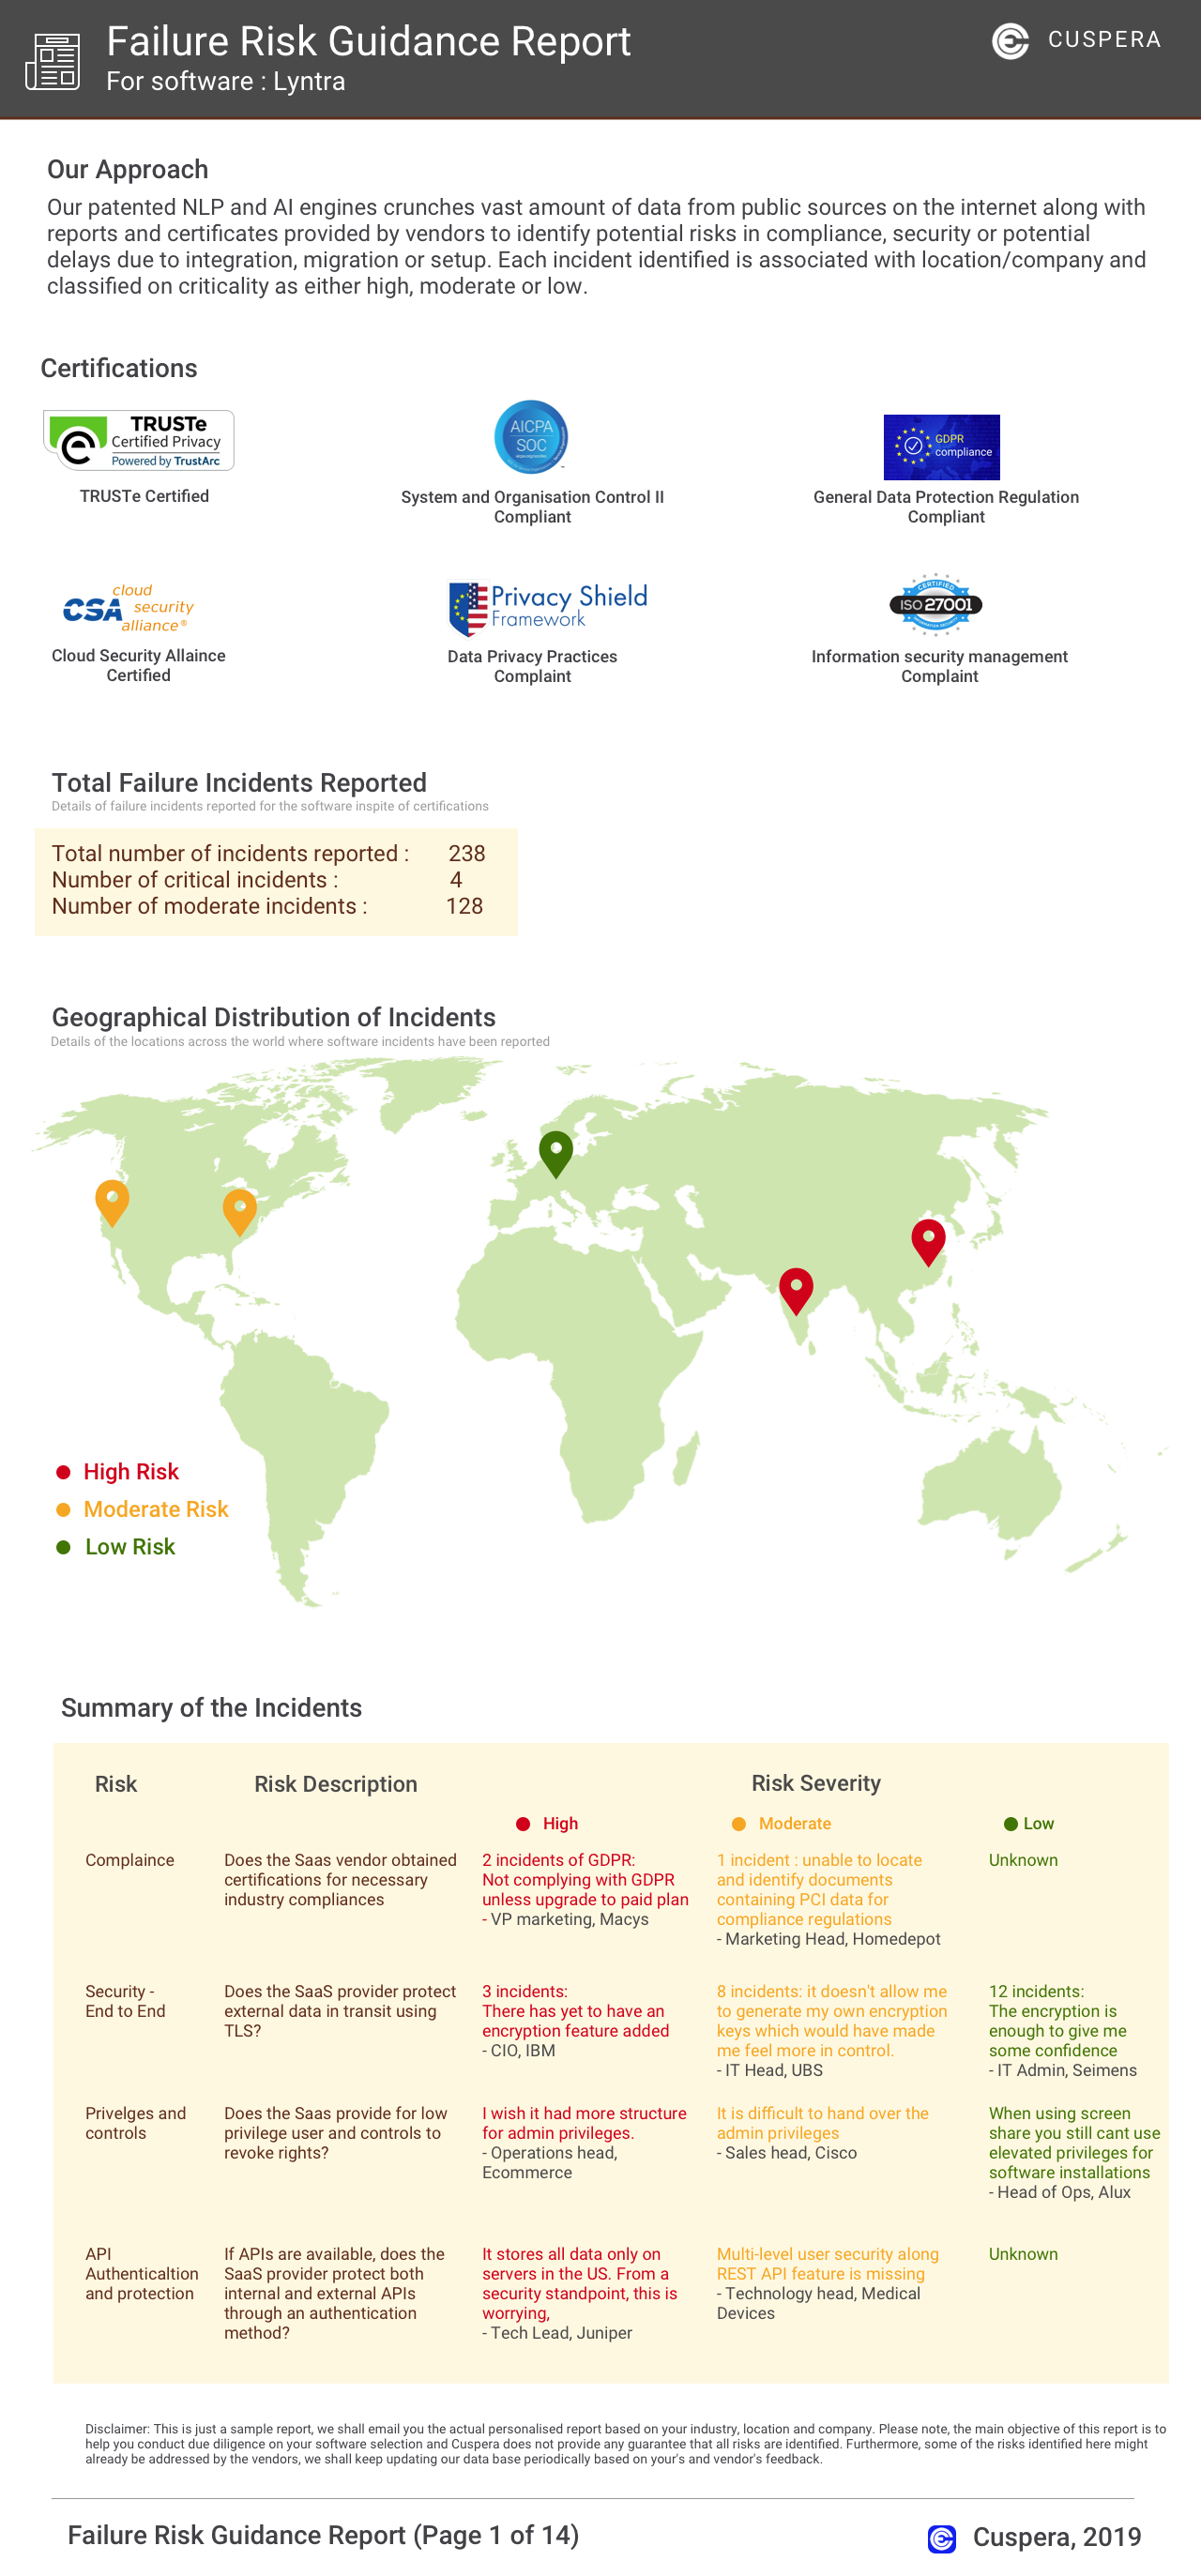
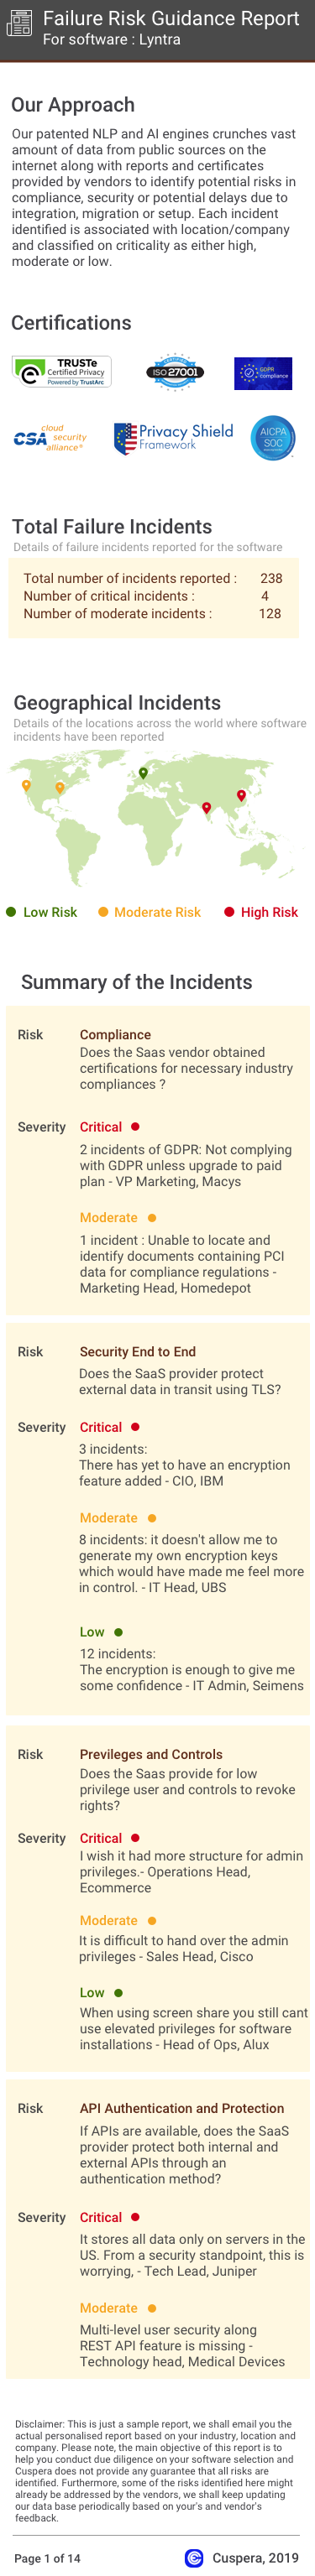
Software Failure Risk Guidance

?

for Q analysis software

Overall Risk Meter

Low Medium High

Top Failure Risks for Q analysis software

Displayr News

Product

Displayr launches AI report tool

Displayr has launched 'Research Agent,' an AI-powered tool that automates the creation of editable reports from survey data. This tool leverages large language models and Displayrs statistical engine to perform tasks like running crosstabs, summarizing findings, and generating charts. It also offers automated analysis, integrated audit trails, and context-aware prompts. Currently, it is available in beta for Displayr customers and trial users.

Product

Displayr Unveils AI-Powered Research Agent

Displayr has launched Research Agent, an AI-powered tool designed to transform survey data into editable reports rapidly. This tool integrates advanced language models with Displayr's statistical engine to automate tasks like crosstabs, chart generation, and report drafting. Available in beta, Research Agent aims to significantly speed up research workflows by providing instant data analysis capabilities.

Displayr Profile

Company Name

Displayr

Company Website

https://www.displayr.com/

HQ Location

65 Bellevue Street, Glebe, NSW 2037, AU

Social